Core Focus
Lagos Market Trends
Primary Tool
Power BI & DAX
Skills Highlighted
Time Series, Geospatial Analysis, ETL
The Business Challenge
A regional QSR operator needed clarity on which branches and which product categories were truly driving profitability versus simply generating high revenue. The goal was to optimize inventory, labor costs, and operational hours based on reliable data.
The Analytical Solution
I used Microsoft Power BI to aggregate transaction data,and do dynamic modeling and visualization.
- Power BI DAX Functions: Wrote complex DAX functions to create key measures and display
- Seasonal Trend Forecasting: Utilized time-series analysis in Power BI to detect predictable sales spikes and dips for efficient staff scheduling and perishable goods ordering.
- Location Scoring: Developed a weighted scoring model incorporating foot traffic and average ticket size to evaluate new potential branch locations.
Key Findings & Business Impact
The analysis revealed that three high-volume branches were operating at 20% below the average profit margin due to poor cost control, allowing for targeted intervention. The findings led to a 15% inventory reduction in slow-moving product lines across the Lagos central district.
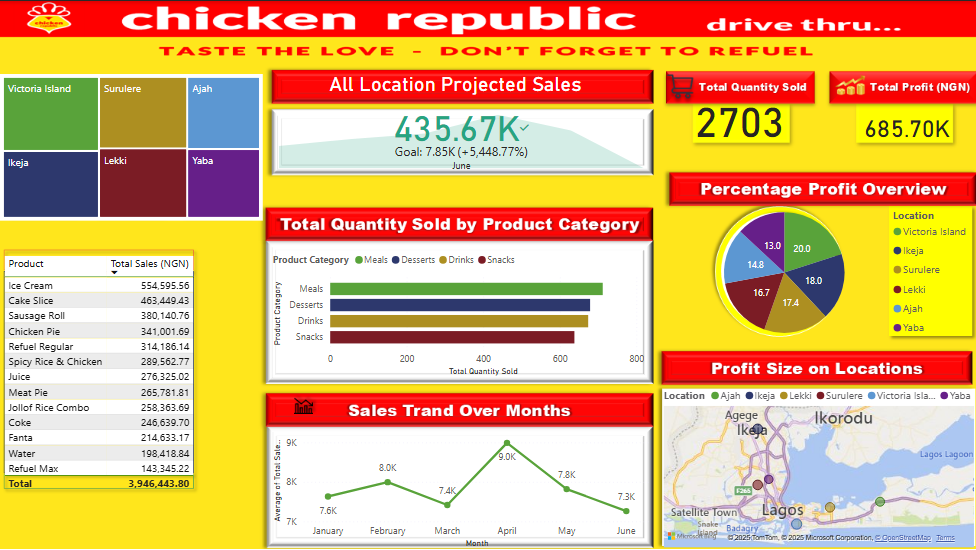
Visualization: Chicken Republic Sales
Interested in Market Optimization?
Explore the full analysis, methodology, and presentation materials.