Core Achievement
+127% YoY Profit
Primary Tool
Power BI (DAX)
Skills Highlighted
Time Intelligence, Data Modeling, Validation
The Business Challenge
The business reported a significant year-over-year profit increase (+127%), but lacked a quantifiable, trustable dashboard to analyze the source of the growth. Leadership needed a reliable tool for performance review and future strategic planning. My challenge was to build a single source of truth that validated the metric and provided drill-down insight.
The Analytical Solution
I designed a star-schema data model and employed advanced DAX (Data Analysis Expressions) to calculate critical time-based metrics.
- Time Intelligence: Created custom measures (e.g., `CALCULATE([Total Profit], SAMEPERIODLASTYEAR('Date'[Date]))`) to accurately compare current profit to the previous year, eliminating data integrity concerns.
- Slicer Synchronization: Ensured that all visuals were interconnected via slicers, allowing leadership to instantly filter by market, product category, or quarter.
- Profit Decomposition: Implemented matrix visuals that allowed the decomposition of profit into sales volume, cost control efficiency, and margin increases.
Key Findings & Business Impact
The dashboard not only validated the +127% profit increase but also revealed that 85% of the growth was driven by a focused strategy on high-margin product categories in the first two quarters, allowing management to double down on these profitable lines.
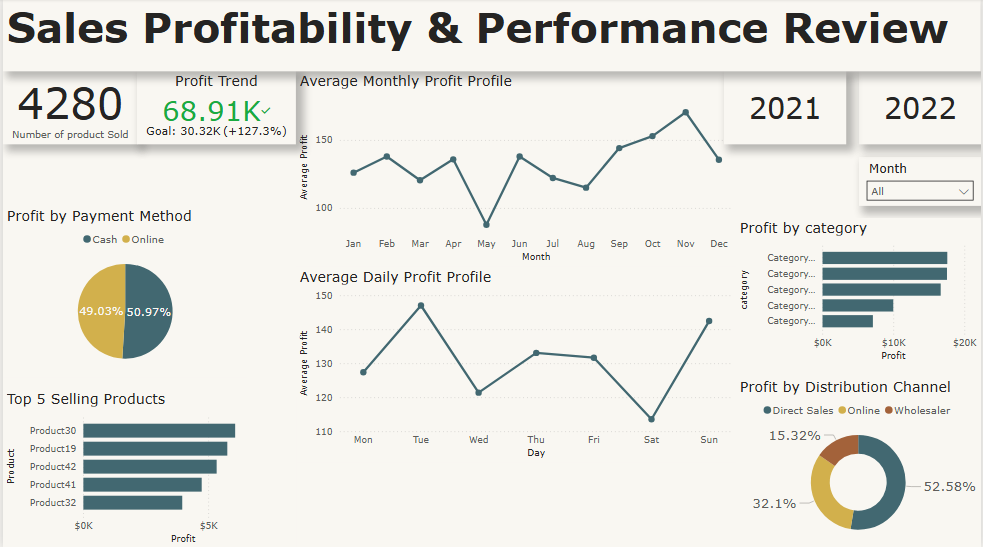
Visualization: Power BI Dashboard showcasing YoY change.